100+ Social Media Marketing Statistics
Social media marketing has inevitably become an integral part of any digital marketing strategy. Over half the world uses social media, warranting the need for brands to be present on social media platforms.
However, social media marketing is obviously more complicated than merely creating profiles and posting content. It requires a thorough understanding of the ever-changing algorithms, trends, and target audience behaviors.
Below, you'll find a list of social media marketing statistics that can help you understand the landscape better and inform your marketing campaigns.
What Is Social Media Marketing?
Before getting into the list of stats, let's quickly go over what social media marketing is.
Simply put, social media marketing means using social media platforms to connect with your target audience. You may use these channels to drive sales, tap into social commerce, build brand awareness, inform and engage your audience, etc.
Some popular social media platforms for marketing include:
Some marketers also use Snapchat and Reddit, but the scope of these platforms isn't as broad.
101 Social Media Marketing Statistics for Marketers
We've categorized the stats into different sections for easy navigation. So, you can either go through them from top to bottom or skip to the section you're most interested in.
General Social Media Usage Statistics
The general consensus across all research studies is that social media usage continues to grow globally. People are spending more and more time on social media, with some platforms getting more traction than others.
-
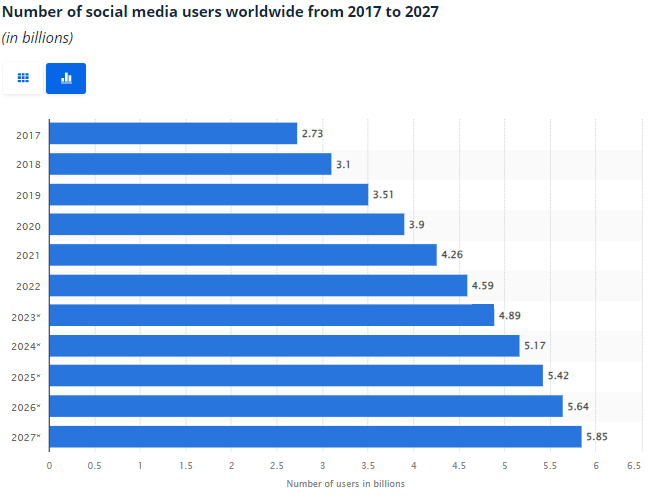
Currently, there are nearly 5.17 billion social media users, a huge jump from just 2.73 billion in 2017. The number of social media users is expected to increase to 5.85 billion by 2027. (Statista)
-
In terms of popularity, Facebook is the most used social media platform, with 3,065 million monthly active users. It is followed by YouTube, which has 2,504 million active monthly users, and Instagram, with 2,000 million active monthly users. (Statista)
-
There are 320.6 million social media users in the United States, a number which has increased from 292.51 million in 2020. By 2029, this number is expected to grow to 342.6 million. (Statista)
-
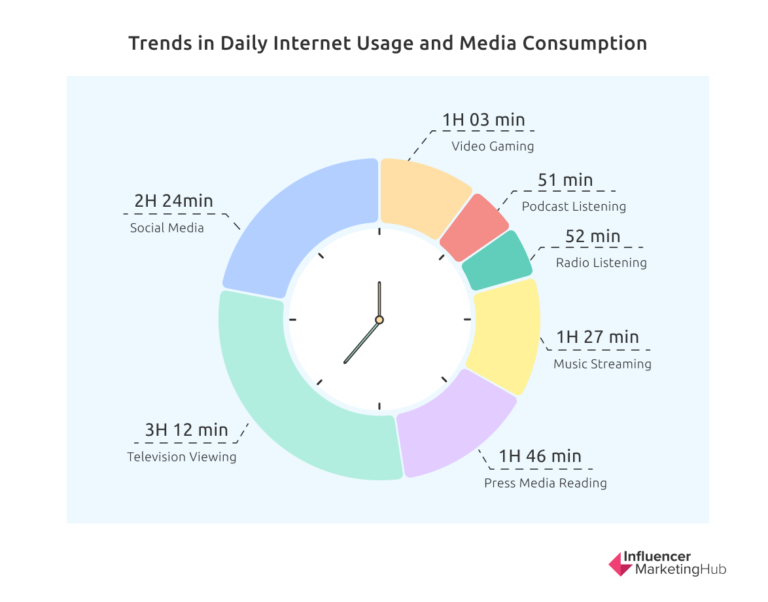
On average, people spend 2 hours and 24 minutes daily on social media. (Influencer Marketing Hub)
-
The amount of time people spend on social media differs across countries, with Nigerians spending the most time at 3 hours and 49 minutes. Colombians spend 3 hours and 44 minutes per day on social media, compared to 2 hours and 15 minutes in the US and only 49 minutes in Japan. (Influencer Marketing Hub)
-
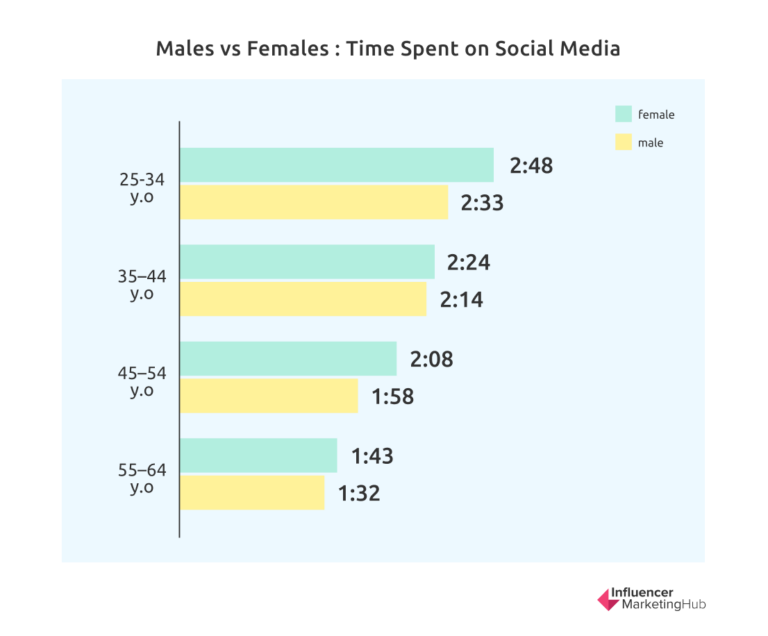
Women generally spend more time on social media than their male counterparts. Young women aged 25 to 34 spend 2 hours and 48 minutes on social media daily, which is the highest across all age groups. (Influencer Marketing Hub)
Social Media Advertising Statistics
Businesses are realizing the potential of social media to reach their customers. There has been a surge in social media advertising in recent years, making it one of the most popular forms of digital advertising. The rise of social commerce has further contributed to social media advertising's growth, as people can now make purchases within apps.
-
Globally, over $296 billion is spent advertising on social media. Social media advertising on mobile is the segment with the highest value of $212.68 billion. (Statista)
-
In 2028, social media advertising is expected to reach 6,054 million users. (Statista)
-
The US is the world's leading social media ad market. (Statista)
-
Facebook is the most commonly used social media platform by marketers, with 89% of marketers using it for advertising. Instagram is the second choice. It is used by 80% of marketers. (Statista)
-
The cost-per-mile (CPM), which is the amount of money it costs for 1,000 impressions for all social media, is $6.06. (Statista)
-
In recent years, the number of impressions on social media has improved by 20%. Most of these impressions are driven by passive ad types, such as stories and videos. (Statista)
-
70% of marketing teams have an employee responsible for social commerce management. (HubSpot)
-
52% of marketers sell products to consumers within social media apps, and 25% of consumers have bought a product directly through social media. (HubSpot)
-
Marketers rank increased exposure as the most significant benefit of social media advertising, followed by increased traffic, lead generation, and fan loyalty. (Statista)
-
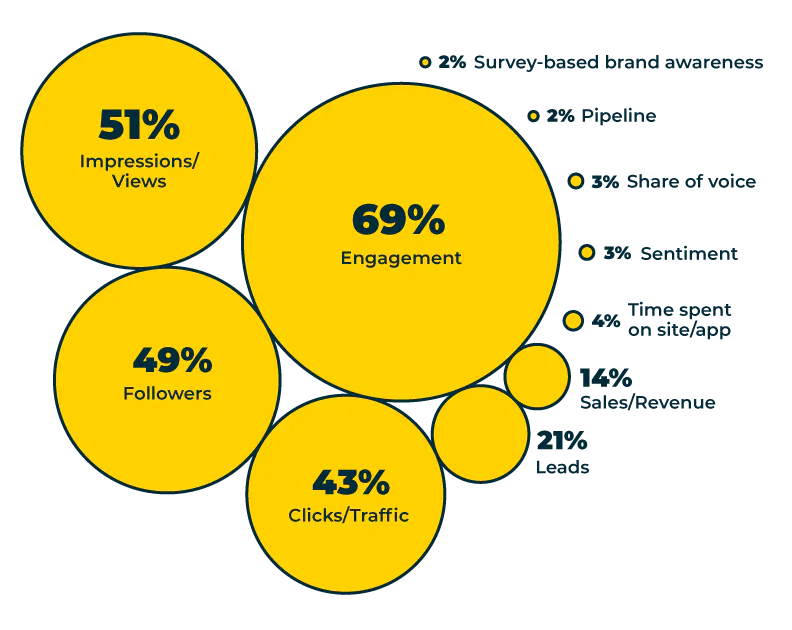
69% of businesses use engagement as a metric to measure the success of their social media efforts, whereas 51% use impressions and views, 49% use followers, and 43% use clicks and traffic to measure the return on investment (ROI). (Hootsuite)
-
22% of consumers say they use social media more often than search engines to find products and brands. (HubSpot)
-
73.8% of internet users use social media platforms to search for information about businesses. (Influencer Marketing Hub)
-
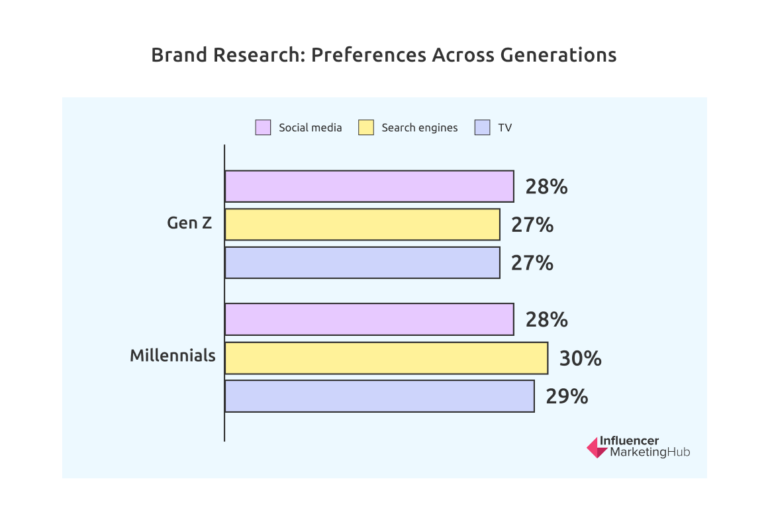
28% of GenZ and millennials use social media for brand research. (Influencer Marketing Hub)
-
87% of social media marketers believe social search to be imperative to their strategies. (HubSpot)
Social Media Marketing AI Statistics
Like every other aspect of marketing, social media marketing is also advancing with the help of AI technology. Marketers are exploring AI for social media content creation, ad optimization, and more.
-
71% of social media marketers use AI in some form. (HubSpot)
-
71% of marketers who have used generative AI to create content say it performs better than the content they've made without AI. (HubSpot)
-
87% of social media marketers believe using AI will be the route to success in social media campaigns in the future. (HubSpot)
-
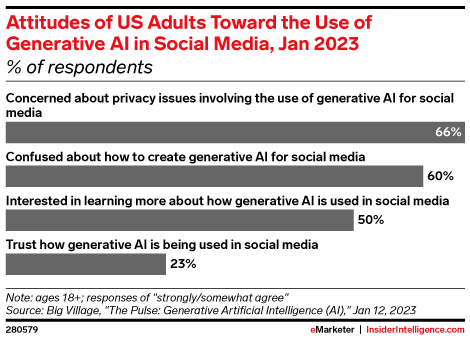
50% of US adults want to learn about the use of generative AI in social media. Also, 23% of US adults trust the way AI is used in social media campaigns and how it's used to deliver content. (eMarketer)
-
AI recommendations have increased the time spent on Facebook by 7%. (Facebook)
-
In just two months of launching, Snapchat's My AI chatbot got over 10 billion messages from the platform's 150 million users. (Snapchat)
-
The ''shop the look'' AI product recommendations on Pinterest have driven conversation rates by 9%. (Pinterest)
-
86% of marketers use AI to edit and refine text for social media posts, 82% use it to develop new ideas, and 52% use Gen AI to generate images. (eMarketer)
Facebook Statistics
You might think Facebook is just for Baby Boomers but guess again. With billions of users, Facebook is the most popular social media platform in the world. It spans across all generations and reaches every corner of the globe. That makes it a powerful tool for social media marketing.
-
Facebook has 3 billion monthly active users. (Statista)
-
The highest number of Facebook users is from India (378 million), with the US trailing with 193 million users. (Statista)
-
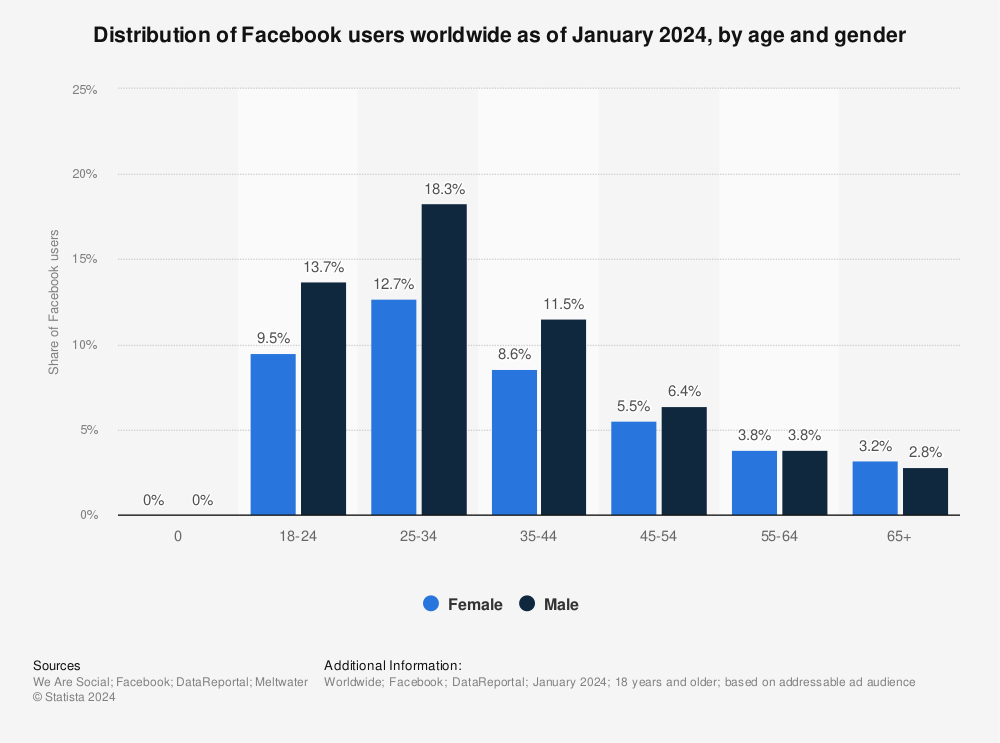
Men aged 25 to 34 make up the largest audience on Facebook. They account for 18.3% of all Facebook users. (Statista)
-
The second largest audience on the platform is also men aged 18 to 24 years. (Statista)
-
In 2023, Meta Platforms, the parent company of Facebook, generated a revenue of $134 billion, much higher than the $119 billion it had earned the year before. (Statista)
-
Facebook accounts for the highest number of referrals from social media to third-party websites. Nearly two-thirds of all social media referrals come from Facebook, compared to 13.31% from Instagram and 8.75% from X. (Data Reportal)
-
Nearly 37.6% of the global population uses Facebook. (Data Reportal)
-
On average, Facebook users spend over 33 hours on the Facebook app per month. (Influencer Marketing Hub)
Instagram Statistics
Instagram, another jewel in the Meta Platforms' crown, has experienced a meteoric rise in popularity, especially among younger audiences. The platform's emphasis on visual content has made it a favorite among millennials and Gen Z.
-
Currently, Instagram has 1.4 billion global users, a rise from 1.04 billion in 2020. (Statista)
-
Most of the Instagram audience is in India, with 362.9 million users from the country. (Statista)
-
The US is in second place with 169.65 million, followed by Brazil with 134.6 million and Indonesia with 100.9 million. (Statista)
-
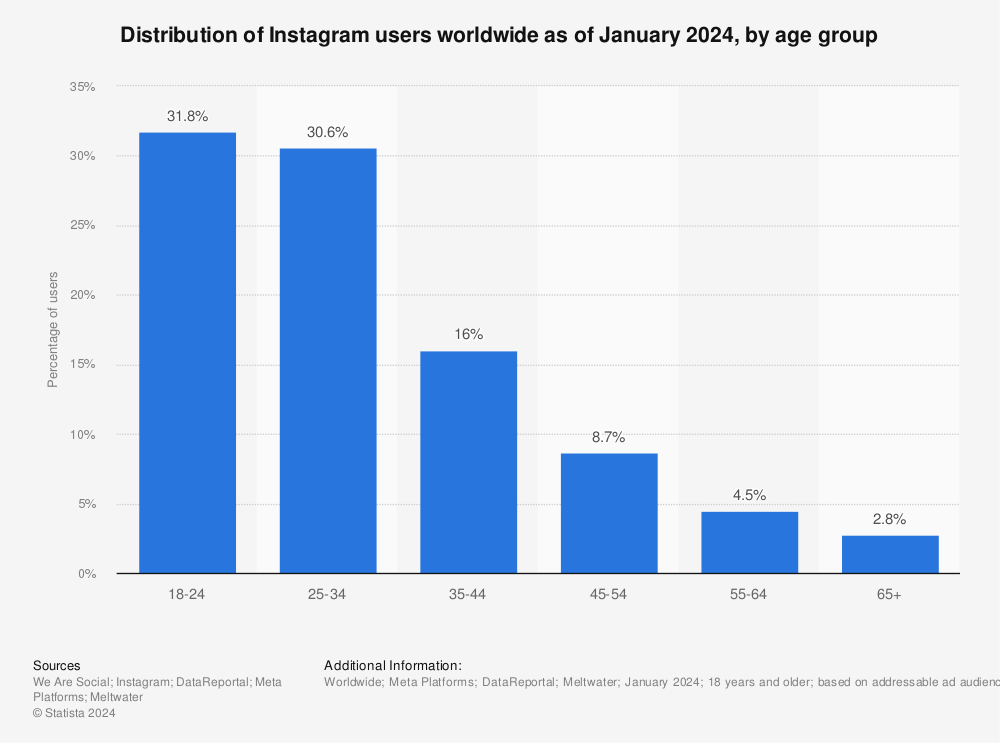
Instagram is dominated by people aged 18 to 24 years, with 31.7% of the users aged in this group. The second largest user age group is 25 to 34 years, which makes up 30.6% of the platform's audience. People aged 65 and over only make up 2.9% of the platform's users. (Statista)
-
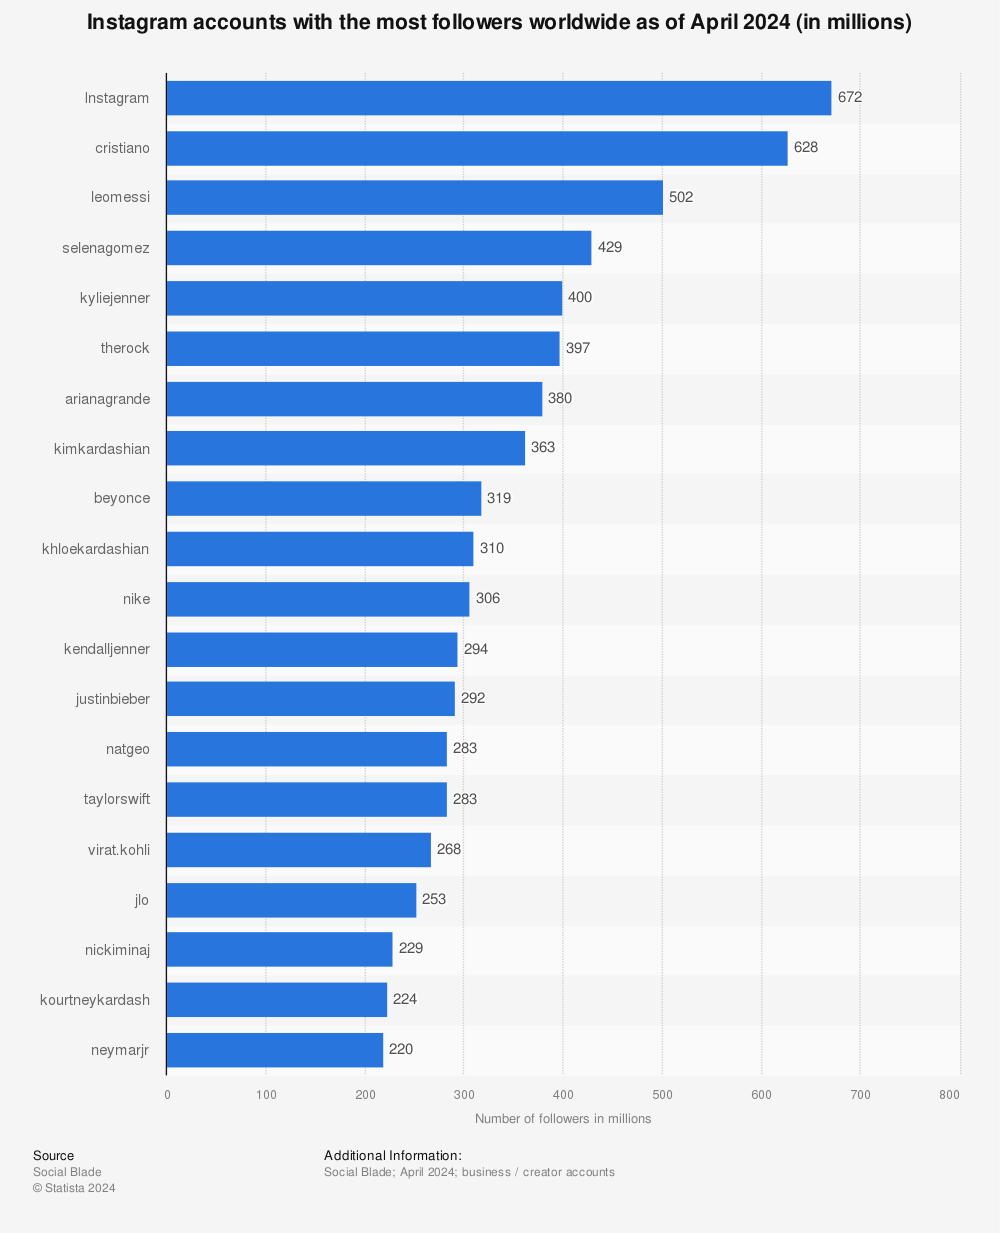
Instagram's own Instagram account is the most followed page on the platform, followed by Christiano Ronaldo's page, which has 628 million followers. Lionel Messi is right behind with 502 million followers, followed by Selena Gomez with 429 million followers. (Statista)
-
On average, Instagram users spend 14 hours and 50 minutes on the app per month. (Influencer Marketing Hub)
-
Instagram has an advertising reach potential of 1.64 billion people worldwide. That's 27.2% of the world's population over the age of 18. (Influencer Marketing Hub)
-
50.3% of the global ad audience on the platform is male, while 49.7% is female. (Influencer Marketing Hub)
-
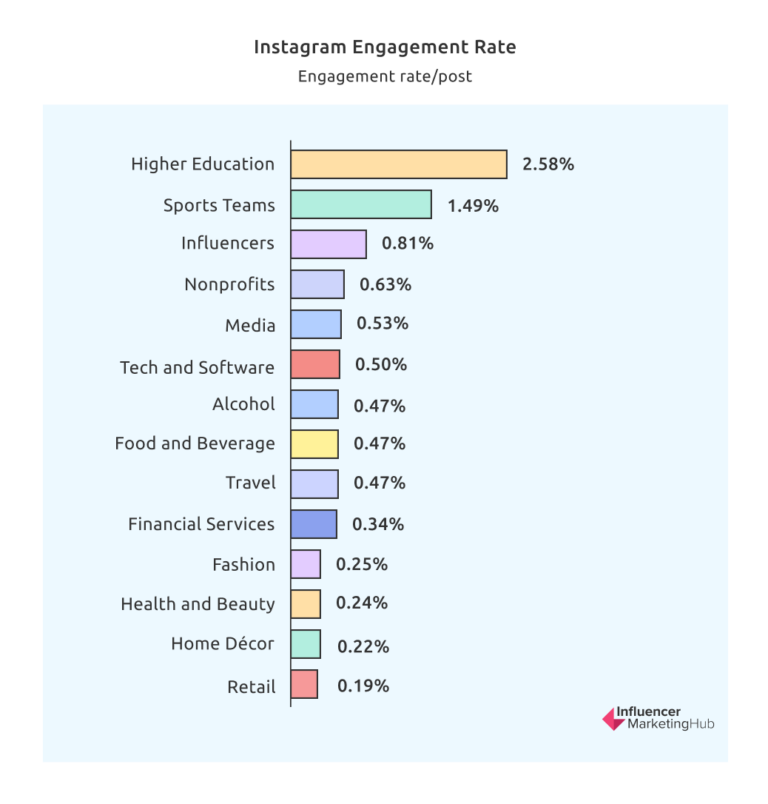
The average Instagram engagement rate per post is 0.47%. However, some industries have a higher than-average engagement rate, such as higher education at 2.58%, sports teams at 1.49%, influencers at 0.81%, and nonprofits at 0.63%. (Influencer Marketing Hub)
-
The most common type of posts Instagram business accounts post are image posts. These posts account for 41.7% of all posts, followed by video posts at 38.2% and carousel posts at 20.0%. (Influencer Marketing Hub)
-
Carousel posts have the highest engagement rate, 0.73%, on Instagram, compared to 0.54% for photo posts and 0.63% for video posts. (Influencer Marketing Hub)
-
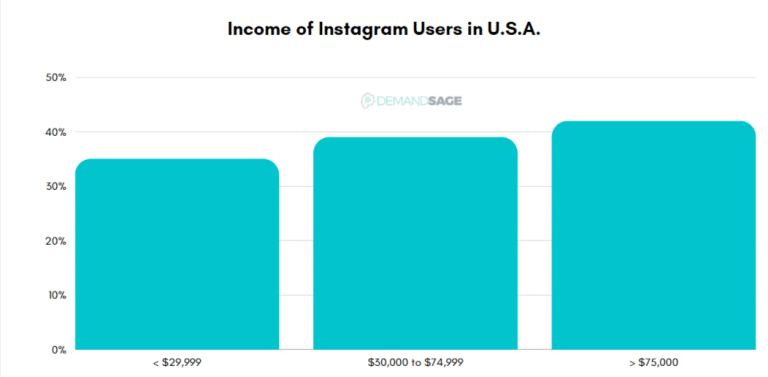
42% of US Instagram users earn under $75k per year, and 39% of them make between $30k to $75k. (Demand Sage)
-
Smaller businesses have a higher engagement rate on Instagram. Accounts with less than 10,000 followers have an engagement rate of 1.22% compared to 0.98% for accounts with up to 100,000 followers. (Influencer Marketing Hub)
-
On average, brands post 4.6 times on Instagram per week. Sports teams post 15.6 times, and media companies post 10 times a week. Other industries that post more than average are retail, fashion, health and beauty, and nonprofits. (Influencer Marketing Hub)
X Statistics
X, previously known as Twitter, has introduced a lot of new features that have given marketers and brands a lot of options to reach out and engage with their target audience.
-
X has 550 monthly active users. (Exploding Topics)
-
58% of X users are under the age of 35. (Exploding Topics)
-
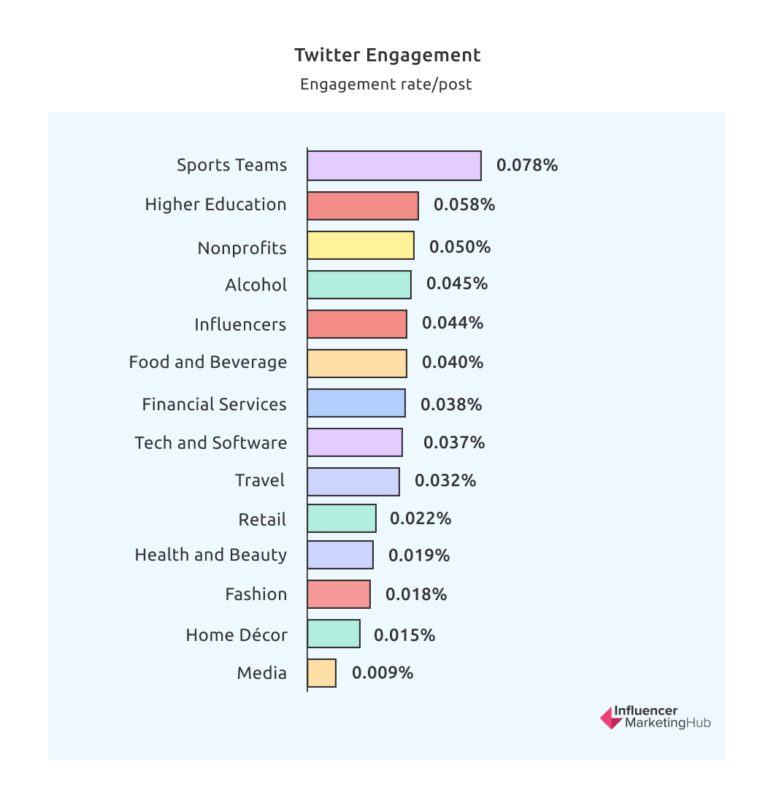
The median engagement rate per post on X is 0.035%. On some accounts, such as sports teams, higher education, nonprofits, and alcohol brands, the median engagement rate surpasses this figure. (Influencer Marketing Hub)
-
Brands post 3.91 posts on average on X. The number of posts is higher in some industries. Media accounts post 70.2 times a week, sports teams post 47 times, and nonprofits post about 10 times. (Influencer Marketing Hub)
-
X ads can read 10.6% of the total global population over the age of 13. (Influencer Marketing Hub)
-
61.2% of the audience on X is male, compared to 38.8% female. (Influencer Marketing Hub)
-
X has the most reach in the US, reaching 108.55 million users. In second place, X ads reach 74.1 million people in Japan, followed by 30.3 million in India and 27.05 million in Indonesia. (Influencer Marketing Hub)
-
X users aged 25 to 34 years make up the largest demographic. They comprise 29.6% of all X users. Users aged 18 to 24 years account for 28.3% of the platform's users. (Exploding Topics)
-
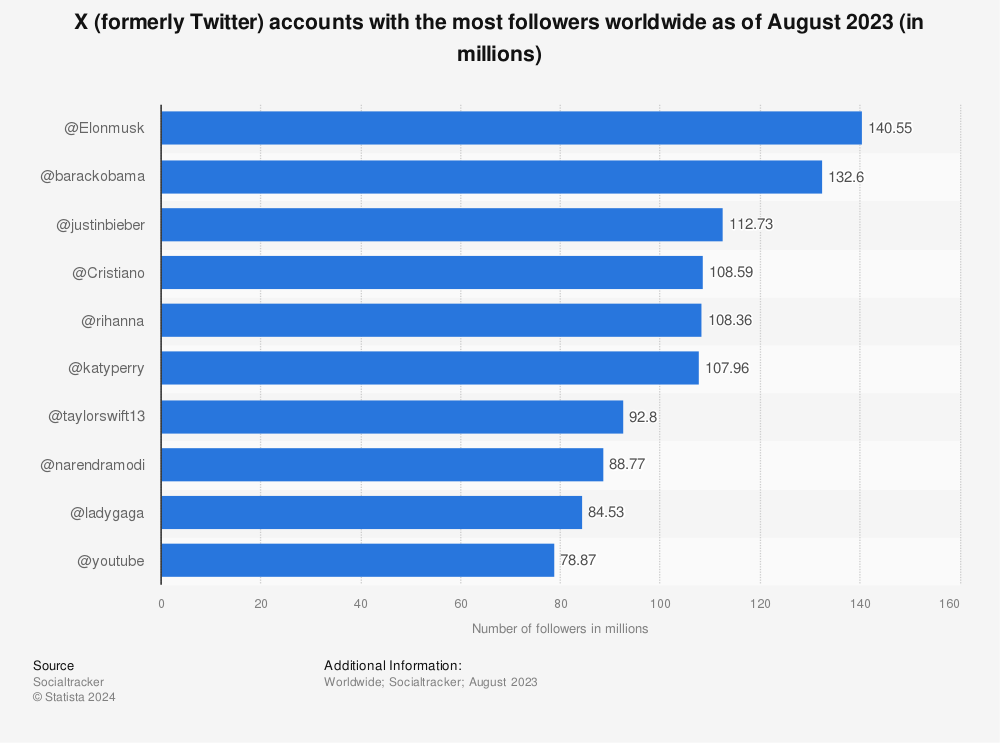
The most followed account on X is Elon Musk's own account, with $140.55 million followers. Other popular accounts include Barack Obama, Justin Bieber, Christiano Ronaldo, Rihanna, and Katy Perry. (Statista)
LinkedIn Statistics
LinkedIn is often considered to be just for professional chit-chat or networking, but it is becoming increasingly popular as a marketing platform, too.
-
There are 1 billion LinkedIn members in over 200 countries. (LinkedIn)
-
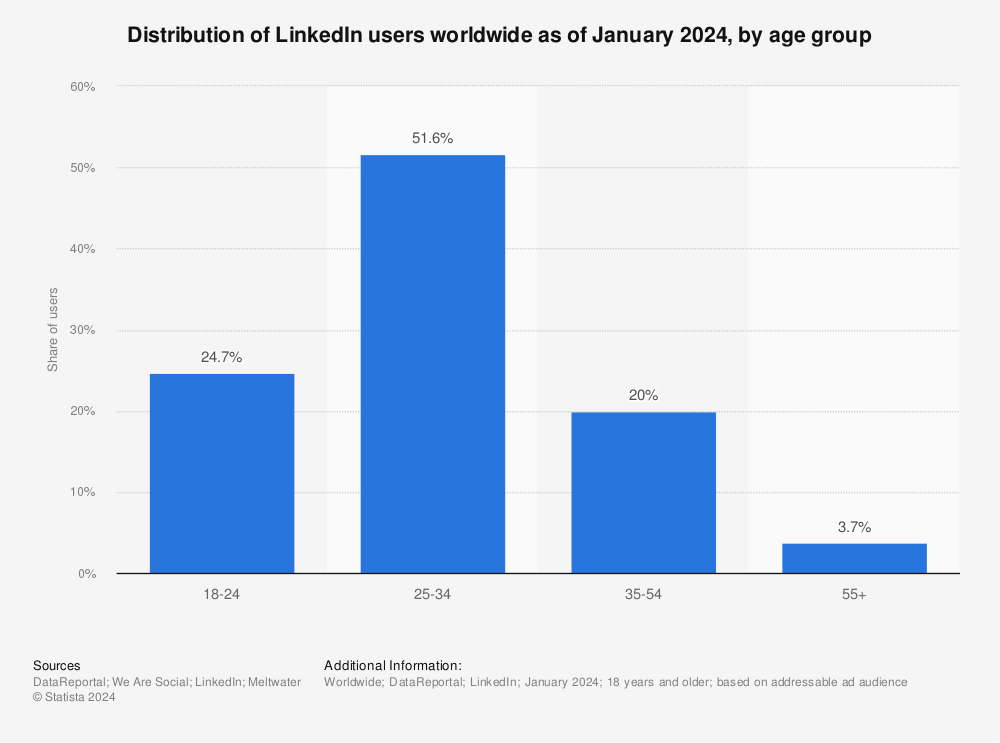
50.6% of LinkedIn users are aged between 25 and 34, while 24.5% of the platform's users are 18 to 24 years old. (Statista)
-
LinkedIn gets 230 million users from the US, followed by India with 130 million LinkedIn users. (Statista)
-
LinkedIn ads have the potential to reach 17.5% of the population over the age of 18. (Influencer Marketing Hub)
-
56.6% of LinkedIn's ad audience is men, while 43.4% is women. (Influencer Marketing Hub)
-
64% of marketers worldwide use LinkedIn in their marketing campaigns. (Statista)
-
48% of B2B marketers believe LinkedIn to be the most important social media platform for marketing. (Statista)
YouTube Statistics
You'd think YouTube is just for your favorite music videos and funny Shorts, but the platform has a massive marketing potential. Since Google Ads also show up on YouTube, it's no wonder the platform is a popular choice for digital marketing efforts.
-
There are 2.1 billion YouTube users worldwide. (Statista)
-
YouTube ranks 78/100 on the American Customer Satisfaction Index (ACSI). (Statista)
-
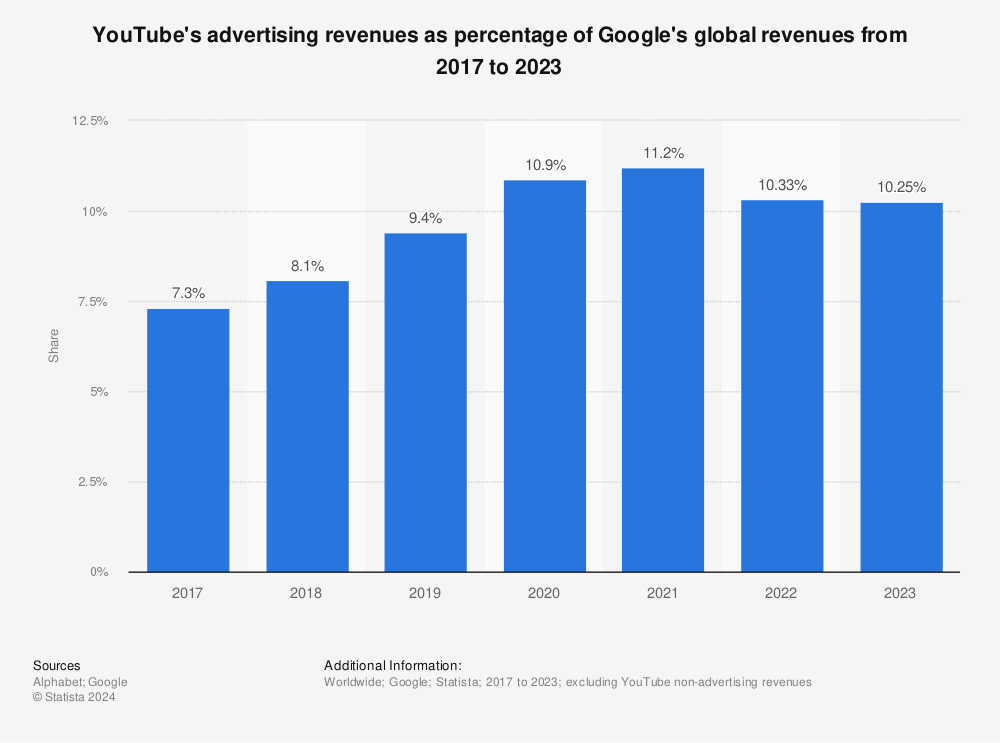
In 2023, the revenue from YouTube accounted for 10.25% of Google's revenue for the year. YouTube contributed $31.5 billion to Google's revenue, an increase from $29.2 billion the previous year. (Statista)
-
YouTube has 462 million users from India, 239 million from the US, 144 million from Brazil, 139 million from Indonesia, and 831. million from Mexico. (Statista)
-
The largest ad audience segment on YouTube is men aged 25 to 34. (Influencer Marketing Hub)
-
76.2% of people who use YouTube also use Facebook. There's a strong correlation between these two platforms, as many YouTubers use Facebook to promote their content and engage with their audience. (Influencer Marketing Hub)
-
The term ''YouTube'' is the fourth most searched keyword on Google. (Influencer Marketing Hub)
-
YouTube viewers spend over 27 hours on the app per month. (Influencer Marketing Hub)
-
YouTube ads can reach 37.5% of the population aged over 18. (Influencer Marketing Hub)
-
54.4% of YouTube's ad audience is male, while 45.6% is female. (Influencer Marketing Hub)
TikTok Statistics
TikTok has garnered a huge following in just a few years, mainly due to its short-form video format and the ability to go viral quickly.
-
TikTok has 1.56 billion active users, and 148.9 million of them are from the US. (Demand Sage)
-
The annual TikTok consumer spending has reached $3.84 billion. (Statista)
-
In the US, TikTok reaches 55.3% of the population. (Statista)
-
In Q4 2023, TikTok was downloaded 232 million times. (Statista)
-
The US has the largest TikTok followers, with Indonesia in second place with 126 million users. Brazil is in third place with 99 million users. (Statista)
-
TikTok ads have the potential to reach 21.5% of the total population over the age of 18. While 50.8% of the app's ad audience is male, the remaining 49.2% is female. (Influencer Marketing Hub)
-
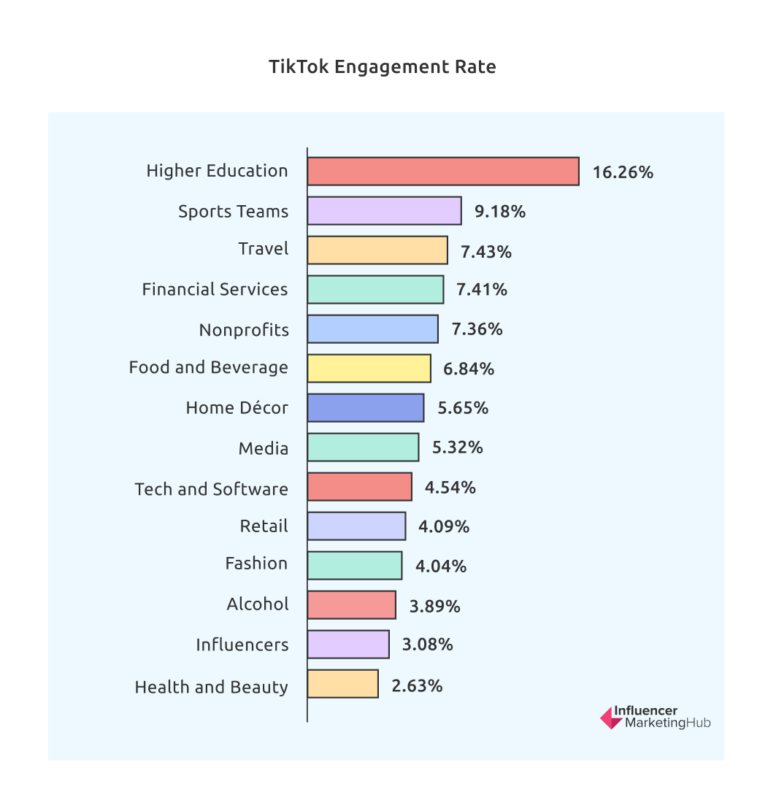
The median engagement rate for TikTok is 5.69%. Posts in the higher education and sports industries have an engagement rate of 16.26% and 9.18%, respectively. (Influencer Marketing Hub)
-
4 in 5 users find TikTok to be very or extremely entertaining. (TikTok)
-
The best brands on TikTok post thrice a week. Most brands post less than 5 times every week. (InVideo)
-
The most popular brands on TikTok are tech, food and beverages, gaming, media, and sports, respectively. (InVideo)
-
Over 90% of TikTok videos have a product placement. (InVideo)
-
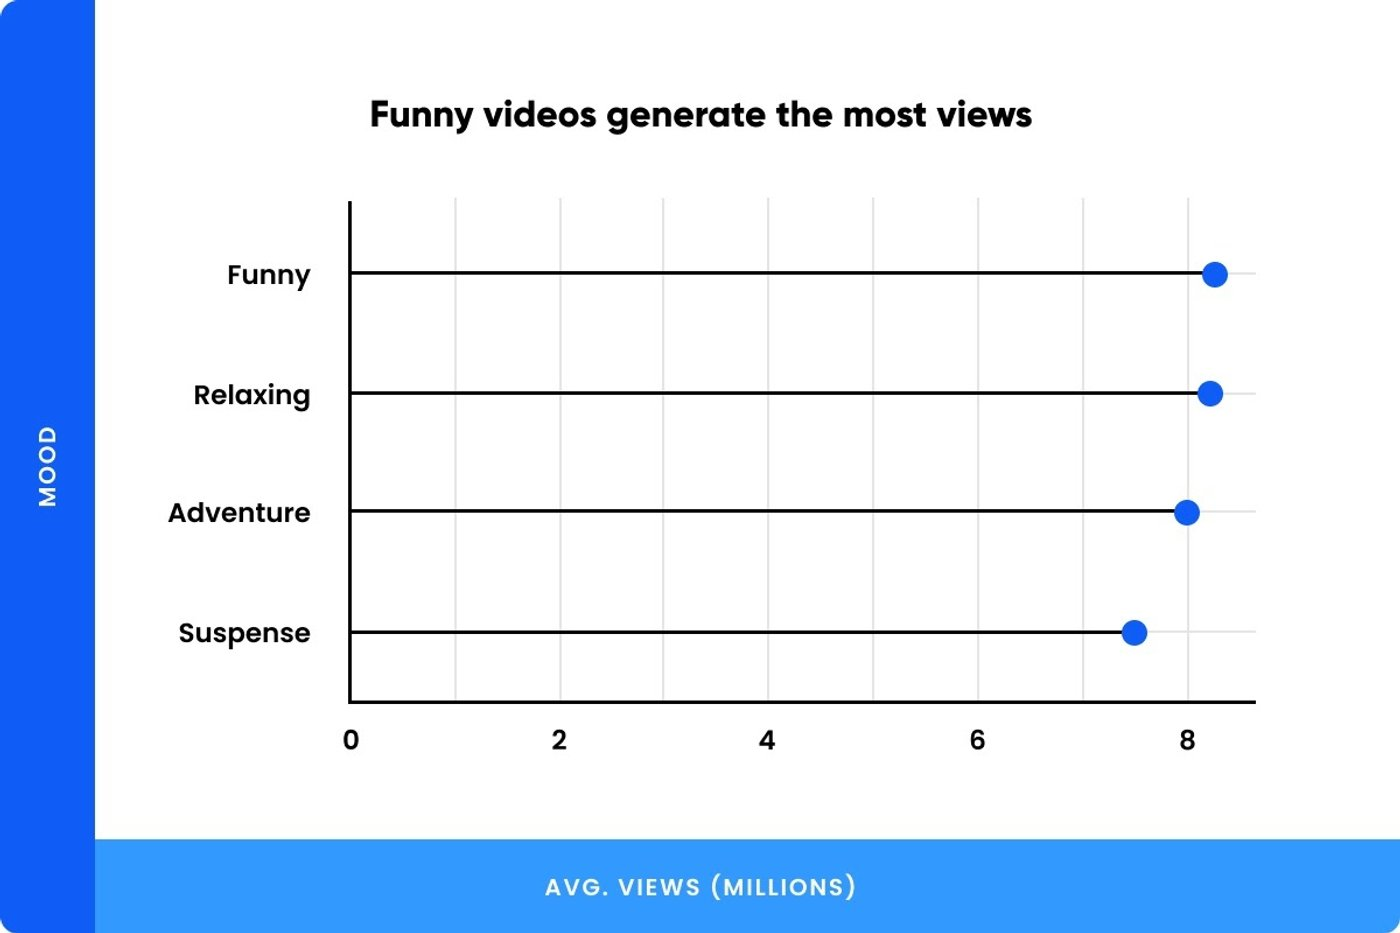
Funny videos get the most views on TikTok, followed by relaxing and adventurous content. (InVideo)
-
65% of TikTok users say they rely on creator recommendations and online reviews to make purchasing decisions. (TikTok)
-
4 in 10 TikTok users say a lift in spirits motivates them to make a purchase. (TikTok)
-
50% of users say the platform boosts their mood. (TikTok)
Pinterest Statistics
Pinterest is where we go to get style inspirations for our new living room, find a new recipe for dinner tonight or plan our dream vacation. Marketers also head over to the platform to reach their audience.
-
Pinterest has 498 active users monthly, most of whom are from the US. The platform reaches 30.7% of the country's population. (Statista)
-
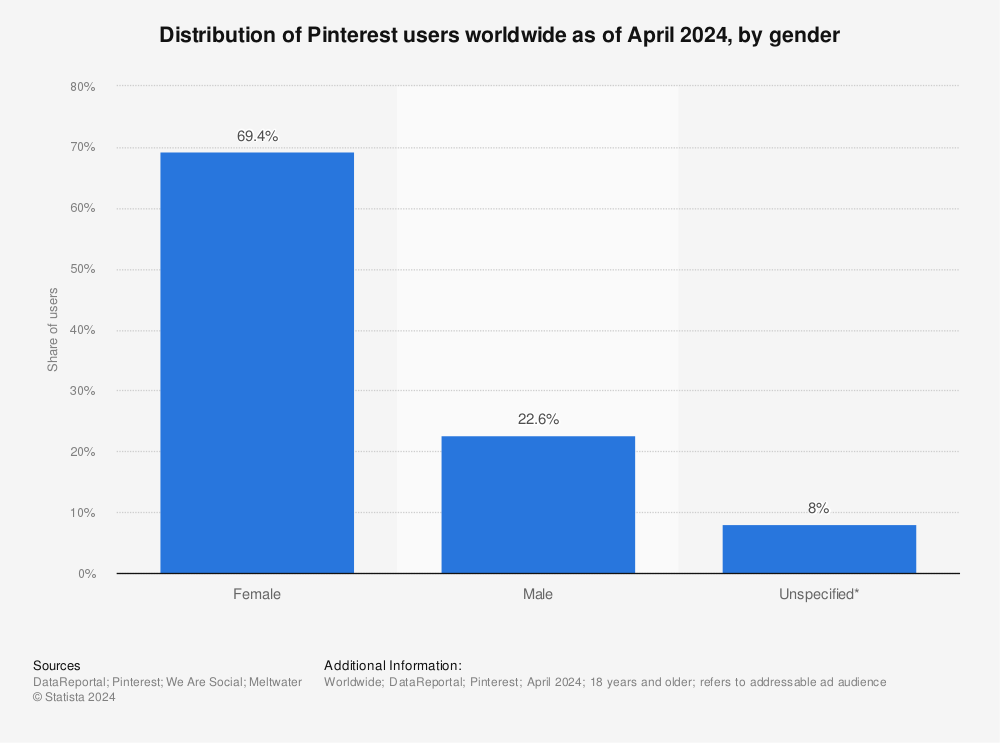
69.4% of Pinterest users are female, 22.6% are males, while 8% are unspecified. (Statista)
-
Pinterest ads can reach 5% of the total population over the age of 18. (Influencer Marketing Hub)
-
17% of Pinterest's global ad audience is male, while 79.5% is female. (Influencer Marketing Hub)
Snapchat
Most people use Snapchat to communicate with friends and family, especially with the streak feature that motivates them to keep snapping. However, the app's popularity also makes it a valuable marketing tool.
-
Snapchat has 431 million daily active users, and the number is expected to grow by 8.35% by 2025. (Bank My Cell)
-
The highest number of Snapchat users is in India. (Statista)
-
Snapchat ads have the potential to reach 9.7% of the total population over the age of 18. (Influencer Marketing Hub)
-
49.5% of Snapchat's ad audience is male, and 49.7% is female. (Influencer Marketing Hub)
-
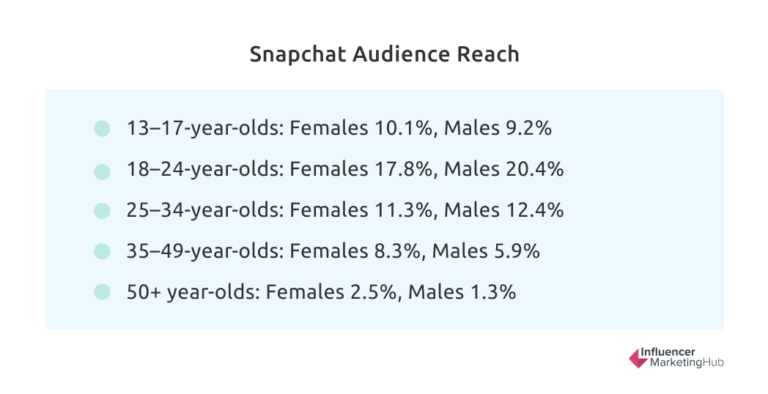
In the age range 25 to 34 years old, Snapchat has 11.3% female users and 12.4% male users. (Influencer Marketing Hub)
-
89% of Snapchat users also have TikTok and Instagram accounts, indicating a possible overlap in target audiences. (Influencer Marketing Hub)
Conclusion
There you go with the latest social media marketing statistics! You can now use them as benchmarks or guidance for your own social media marketing efforts.
These statistics keep changing with time, so you should keep track of them regularly. Right now, it seems that AI will be entering the space, and video content or video-based platforms will continue to dominate.